
4 actions to cut excess stock: sell-in vs sell-through for food wholesalers
Sell-in counts what a brand ships and invoices to a retailer; sell-through counts what the retailer actually sells to the end consumer. Sell-through is the real signal of demand, because sell-in can look healthy while shelves quietly gather dust. Get this distinction wrong and you plan next season’s production on shipments, not sales, which is how warehouses end up full and margins end up thin.
TL;DR:Relying solely on sell-in data can lead to overestimating demand, increasing the risk of excess stock and margin erosion in subsequent seasons.Tracking full-price sell-through separately and regularly helps identify replenishment issues and prevents the sell-through hangover.Use POS data and retailer portals frequently, with weekly or monthly reviews, to better manage inventory and optimize replenishment tasks.Improving sell-through involves balancing replenishment, merchandising, pricing, and operational adjustments in sequence for maximum impact.Combining sell-in and sell-through insights reduces working capital tied in unsold stock and refines demand forecasts for production planning.
WoodfordTurn Food Trends Into Retail GrowthWoodford helps visionary food brands reach ambitious independent retailers through curated distribution and hassle-free logistics.Explore Woodford
Table of Contents
- Sell-in vs sell-through: definitions and where sell-out fits
- How do you calculate sell-through rate?
- Why the sell-in and sell-through gap matters commercially
- How to measure and report sell-through across retail partners
- How to improve sell-through: a prioritised playbook
- Applying sell-through in wholesale food distribution
- How sell-in and sell-through shape inventory and supply chain decisions
- Forecasting demand and production planning
- Digital tools for tracking sell-in and sell-through
- Online vs brick-and-mortar: does the calculation change?
- Sources
Sell-in vs sell-through: definitions and where sell-out fits
Three terms get used loosely, and that loose usage is where most reporting arguments start.
- Sell-in is the wholesale transaction: units a brand ships and invoices to a retailer, recorded on the brand’s own sales ledger.
- Sell-through is the retail transaction: units the retailer actually sells to a shopper, tracked through point-of-sale (POS) data, stock counts, or retailer portals.
- Sell-out is often used interchangeably with sell-through, though some sectors reserve it specifically for the final consumer sale in a longer distribution chain (brand to distributor to retailer to consumer).
Picture the flow: a snack brand ships 5,000 units to a regional grocer (sell-in). Over the following eight weeks, the grocer’s tills ring up 3,200 of those units to shoppers (sell-through). The remaining 1,800 sit in the stockroom or on shelf, and that gap is where the real story lives. Because definitions shift between industries and even between retail agreements, agree a shared glossary with every partner before you start comparing numbers.
How do you calculate sell-through rate?
The standard formula is straightforward:
- Take units sold to the consumer over your chosen period.
- Divide by units received or units available during that same period.
- Multiply by 100 to get a percentage.
The denominator choice matters more than people assume. “Units received” measures how much of a specific shipment has cleared; “units available” (received plus any carried-over stock) measures how the retailer is working through total inventory on hand. Retailers doing seasonal planning tend to favour the second.
Pro Tip: *Track full-price sell-through separately from overall sell-through.
Say a boutique receives 500 units of a candle range and sells a significant portion to consumers within the month, demonstrating strong sell-through performance. Industry guidance recommends measuring this monthly rather than quarterly, because monthly cycles catch replenishment problems before they become writeoffs.
Why the sell-in and sell-through gap matters commercially
Chase sell-in numbers alone and you’re rewarding shipments, not sales. That’s how a brand ends up with a warehouse full of returns six months later.
The pattern has a name worth knowing: the sell-through hangover. A brand pushes stock to hit a quarterly shipment target, the retailer accepts it to keep the relationship warm, and then nobody actually sells it. What follows is predictable:
- Retailers cut shelf space for the brand next season.
- Purchase orders get cancelled or shrunk on the next cycle.
- Markdowns eat the margin that looked so good on the sell-in invoice.
Finance teams naturally watch sell-in, because that’s what hits the revenue line and gets recognised in the accounts. Sales and trade marketing teams live and die by sell-through, because that’s what determines whether the retailer reorders. Brands that shift their planning process to centre on sell-through data tend to cut excess inventory at season exit and free up cash rather than tying it up in unsold stock.
There’s a subtler trap too: a brand-level sell-through figure can hide serious store-level imbalance. Average the numbers and you’ll miss both problems.
How to measure and report sell-through across retail partners
Good sell-through reporting depends on where the data comes from and how often you look at it, not just the formula itself.
Primary data sources, roughly in order of reliability:
- POS data direct from the retailer’s till system, ideally via EDI feed for automatic updates.
- Retailer portals, where partners self-report sales and stock, common with larger chains.
- Retailer-supplied reports, manually shared spreadsheets or emails from smaller independents.
- Sample-door tracking, where full coverage isn’t feasible; a representative subset of stores can still flag demand trends and justify a replenishment conversation without needing every door wired up.
On cadence, weekly reviews suit replenishment decisions because slow-moving stock needs catching before it becomes markdown stock. Monthly reviews suit planning and finance reconciliation, where you’re looking at trends rather than reacting to a single bad week.
The dashboard that actually gets used shows sell-in and sell-through side by side, with the gap broken out by SKU and by store cluster rather than buried in a brand-wide average. That single view is usually what settles the finance-versus-commercial argument before it starts.
How to improve sell-through: a prioritised playbook
Improving sell-through isn’t one lever, it’s four working together, roughly in order of impact:
- Replenishment. Match supply to actual velocity using frequent restocking, store clustering, and transfers between doors rather than waiting for a full seasonal reorder cycle.
- Merchandising. Adjust local assortments to match regional demand, refresh point-of-sale materials, and tweak planograms so fast movers get better shelf position.
- Pricing and promotions. Protect full-price sell-through with guardrails on discounting depth and frequency; a measured, time-boxed promotion moves stock without training shoppers to wait for the next markdown.
- Operations. Shorten lead times so replenishment orders actually arrive while demand is still live, tighten return handling, and reconcile receipts quickly so your sell-through numbers reflect reality rather than a two-week-old snapshot.
Pro Tip: Real-time replenishment driven by POS velocity and on-hand stock keeps high-velocity stores stocked while trimming excess from slow ones, which lifts full-price sell-through without a single markdown.
Sequencing matters here. Fix replenishment first; better pricing on a badly stocked shelf still won’t sell.
Applying sell-through in wholesale food distribution
Food wholesale runs on tighter margins and shorter shelf life than most categories, so reconciling sell-in against sell-through isn’t optional, it’s the difference between a reorder and a returns pallet.
Take a regional snack brand distributed through independent grocers. Sell-in numbers might show three consecutive strong months of shipments. Sell-through data pulled from retailer portals tells a different story: two SKUs are moving briskly while a third variant is sitting untouched in a fifth of the doors carrying it. The correct move isn’t cutting the whole line, it’s rebalancing the assortment towards the two performers and pulling the slow one back to a smaller set of stores.

That kind of decision depends on clean inventory data feeding into assortment choices, which is where practical inventory management discipline earns its keep, alongside tighter wholesale workflows that keep receipts and reconciliation current enough to trust.
How sell-in and sell-through shape inventory and supply chain decisions
Every stock decision downstream of a sales forecast inherits whichever metric drove that forecast. Build production and warehouse plans on sell-in alone, and you’re planning around what retailers agreed to accept, not what shoppers actually want.
The consequences show up fastest in working capital. A brand shipping to targets rather than to sell-through data ties up cash in stock sitting in retailer backrooms, stock that counts as “sold” on the brand’s books but hasn’t generated a penny of pull-through demand. When that stock eventually gets returned or marked down, the hit lands on a future quarter’s margin, distorting the picture twice.
Sell-through data, by contrast, feeds directly into safety stock calculations, reorder points, and warehouse allocation. If a distribution centre knows a SKU is moving at 200 units a week at retail rather than 500 units a month at wholesale, it can hold the right buffer stock without overcommitting warehouse space to a slow mover. This matters most in food distribution, where shelf life turns an overstock problem into a write-off problem within weeks rather than months.
Supply chain teams that track both metrics together can spot a widening sell-in/sell-through gap early enough to slow production or redirect stock to better-performing accounts, rather than discovering the imbalance when a retailer cancels a purchase order outright. The gap itself functions as an early-warning system, arguably more useful for operational planning than either number alone.
Forecasting demand and production planning
Sell-in numbers are backward-looking receipts of what already shipped. Sell-through numbers, tracked consistently, become the input for forecasting what shoppers will actually buy next.
Production planning built on sell-in tends to amplify whatever happened last cycle, because a strong shipment quarter looks like strong demand even when a third of it is sitting unsold in a stockroom. Production planning built on sell-through reflects consumer behaviour more directly, which matters enormously for categories with genuine seasonality or trend sensitivity, where getting the forecast wrong by even a few weeks means missing the selling window entirely.
Retailers themselves are increasingly using their own sell-through analytics to decide how conservatively they buy next season, which means brands that keep planning around sell-in risk losing shelf space to competitors who can demonstrate real consumer pull with data, not just shipment history.
None of this requires abandoning sell-in as a metric. Finance still needs it for revenue recognition, and production still needs lead-time visibility months ahead of any sell-through signal. The practical fix is layering sell-through trend data on top of sell-in forecasts, so a production run gets sized against what’s likely to actually sell, with a margin of safety stock rather than a guess dressed up as a forecast.
Digital tools for tracking sell-in and sell-through
Manual sell-through tracking, spreadsheets pieced together from retailer emails, works for a handful of accounts and falls apart past a few dozen. The tools that matter here fall into three categories.
EDI (Electronic Data Interchange) feeds pull POS and stock data automatically from larger retail partners, removing the lag between a sale happening and a brand knowing about it. Retailer self-service portals give access to sell-through figures for chains too small or too fragmented to run full EDI integration. Dashboarding and inventory platforms sit on top of both, pulling sell-in and sell-through into one view rather than forcing someone to reconcile two spreadsheets by hand every Monday morning.
For online retail specifically, keeping product feed data accurate matters just as much as the sales data itself: a mismatched or outdated listing skews the sell-through figures pulled from it, because you can’t trust a sales rate calculated against the wrong stock count. Getting product feed data properly optimised keeps that baseline clean before any sell-through analysis happens on top of it.
The bigger shift isn’t the software, it’s what teams do with the output. A dashboard showing sell-in and sell-through side by side is only useful if someone actually acts on the gap it reveals, whether that’s a replenishment call, a markdown decision, or a hard conversation with a retail buyer about why a purchase order needs cutting back.
Online vs brick-and-mortar: does the calculation change?
The formula stays identical. What changes is how fast the data arrives and how much of it you actually get to see.
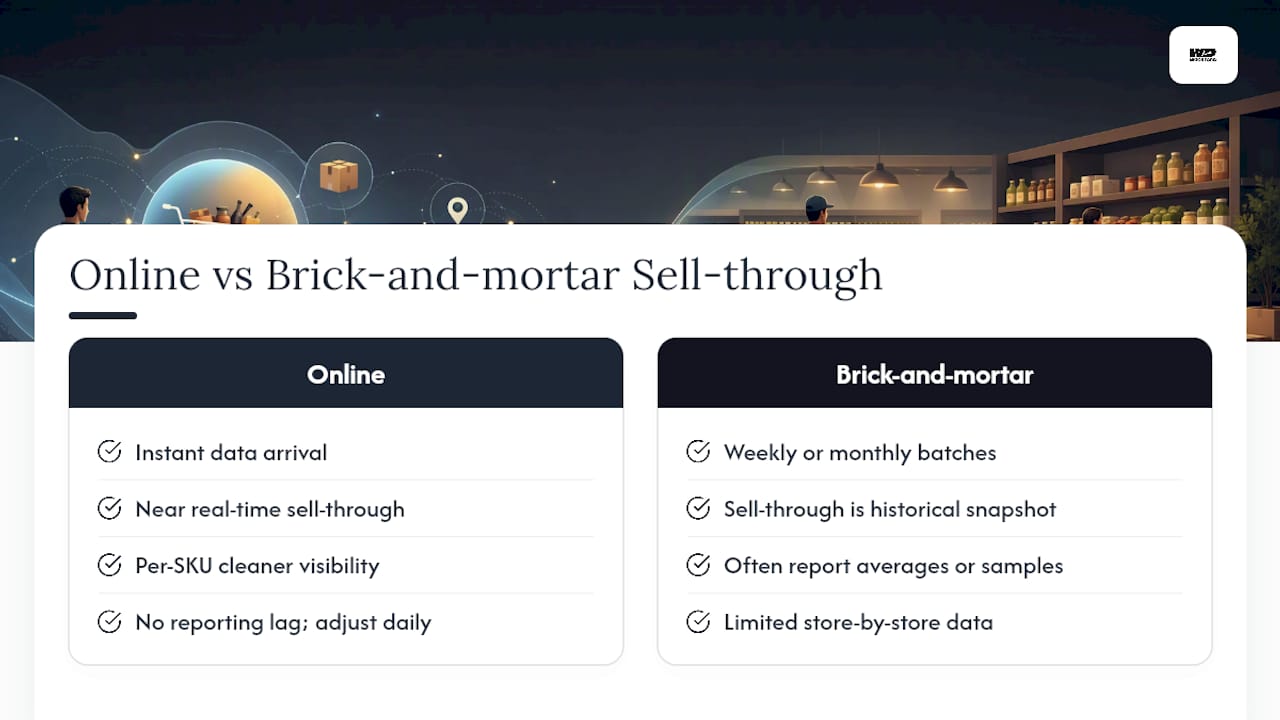
Online, every sale registers instantly against a known stock count, so sell-through can be calculated in near real time and adjusted daily if needed. A brick-and-mortar retailer, by contrast, often reports sell-through weekly or monthly, batched from till systems that may or may not sync cleanly with the brand’s own records. That lag means physical retail sell-through is always somewhat historical, a snapshot of last week rather than right now.
Brick-and-mortar also carries a visibility problem online doesn’t have: multi-door retailers rarely hand over full store-by-store data, so brands often work from averages or a sample of doors, missing the store-level imbalance that a brand-wide figure can hide. Online sellers, whether selling direct or through a marketplace, typically get cleaner per-SKU visibility, though marketplace sales mixed with a brand’s own site can blur which channel actually drove a given sell-through number unless reporting separates them out.
The practical takeaway: treat online sell-through as your fastest, cleanest signal for spotting demand shifts early, and treat physical retail sell-through as the slower, noisier signal that needs sampling and store clustering to read accurately.
Wholesalers working across both channels benefit from partners who can support assortment decisions with real distribution reach rather than guesswork. Woodford’s brand portfolio is built around exactly that kind of trend-led, demand-informed curation for independent retailers, and pairing that with sound wholesale pricing strategy keeps full-price sell-through protected rather than eroded by reactive discounting. If you’re a brand owner or retail buyer looking for a distribution partner that treats sell-through as seriously as shipment volume, get in touch with Woodford to talk through your assortment.


