
The role of data in retail buying: a guide for UK independents
Data replaces guesswork with predictable reorders and collaborative category planning. When you connect your EPOS sales to wholesaler category reports and schedule a 30-minute quarterly review, you stop reacting to stockouts and start preventing them. Woodford, KPMG UK, and The Wholesale Group all point to the same conclusion: shared, timely data cuts stock risk and protects margin.
Three things you can do this week:
- Export your top 20 lines from your EPOS system and check sell-through rate against current stock-on-hand.
- Ask your wholesaler for a category performance report covering the last 12 weeks.
- Book a 30-minute slot in your diary for a quarterly review correlating orders, sales, and wastage.
Table of Contents
- Why does data matter in retail buying?
- What data types do you actually need, and where do you get them?
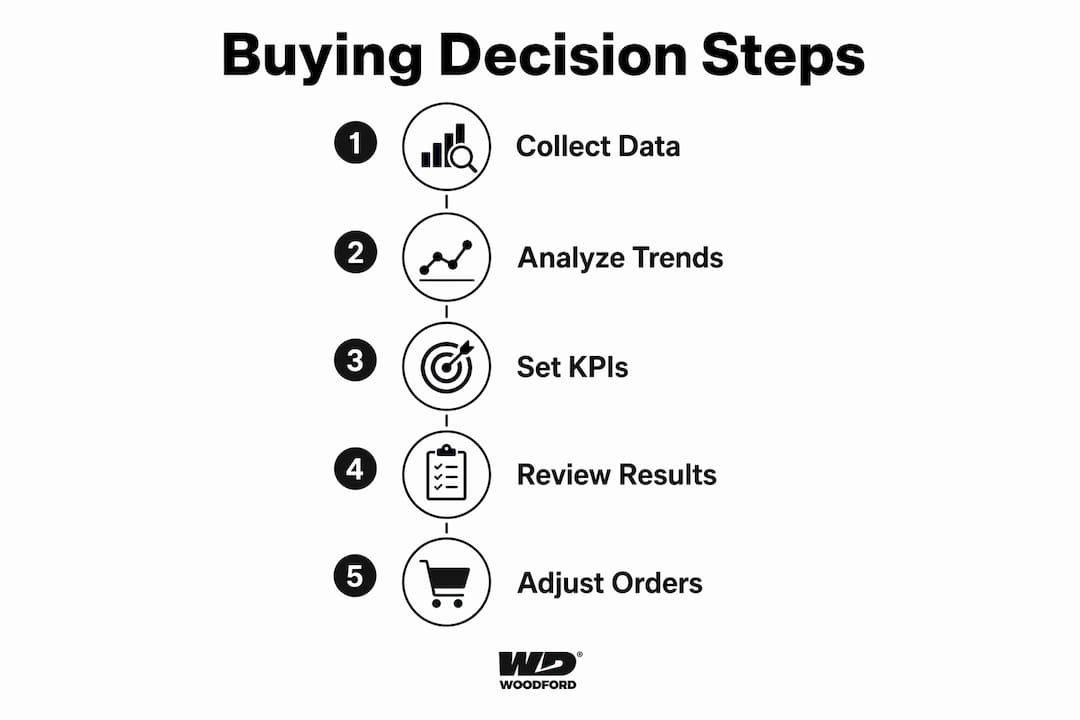
- How do you turn data into a buying decision? A five-step process
- How can wholesalers and suppliers help you plan with data?
- What tools should you choose, and how do you evaluate them?
- What are the most common data mistakes buyers make?
- What does an implementation plan look like for a UK independent?
- A UK case example: wholesaler data improving category performance
- How should you handle privacy and data security when sharing sales data?
- How do you train staff to use data in buying decisions?
- How do you combine customer feedback with sales data to buy more accurately?
- Key takeaways
- Woodford gives UK independents a data-enabled buying advantage
- Useful sources and further reading
Why does data matter in retail buying?
Reactive buying is expensive. You order too much of a slow line, run out of a fast one, and spend margin on markdowns you could have avoided. Data turns that cycle into a planned process where reorder points are set by evidence, not instinct.
The concrete benefits for independents and F&B brands are measurable:
- Fewer stockouts. When you know your days-of-cover figure, you reorder before the shelf empties rather than after a customer complaint.
- Less overstock and waste. Tracking expiry and markdown histories tells you which lines to cut before they become a write-off.
- Higher basket value. Promotions built on sales data rather than supplier persuasion tend to lift average transaction values because they target lines customers already want more of.
- Stronger supplier negotiations. A clean demand history, especially one held in a digital ordering portal, gives you verifiable evidence when pushing back on minimum order quantities or lead times.
The GOV.UK Business Data Use and Productivity Study found that data-active businesses report improved products and internal efficiency, with stock and supply data among the most commonly used datasets in wholesale and retail. That is not a coincidence.
What data types do you actually need, and where do you get them?
Most independent retailers already hold more useful data than they realise. The gap is usually in accessing it cleanly and knowing which external sources to add.

| Data type | Typical UK source | Immediate use |
|---|---|---|
| EPOS/POS sales by SKU | Your till system (Lightspeed, Square, Epos Now) | Sell-through rate, reorder triggers |
| Wholesaler category reports | Wholesaler portal or account manager | Range gaps, volume trends, competitor lines |
| Supplier lead times and availability | Supplier sales rep or order confirmation emails | Safety stock calculation, order cadence |
| Promotion and markdown history | Your own records or EPOS promotions module | Promotion ROI, clearance timing |
| Stock-on-hand and inventory value | Stock management system or spreadsheet | Days of cover, cash tied up in slow lines |
| Waste and expiry data | Waste log or EPOS write-off function | Lines to delist or reduce order frequency |
| Market trend feeds | Kantar, Nielsen, or free ONS retail sales data | Emerging categories, seasonal demand shifts |
A few practical notes on sourcing. Your EPOS vendor can usually export a CSV of sales by product for any date range; if yours cannot, that is a signal to switch. Wholesaler category reports are often available on request even when they are not automatically shared. ONS retail sales indices are free and updated monthly, giving a useful macro backdrop for your own store-level numbers.
How do you turn data into a buying decision? A five-step process
The process below is repeatable. Run it once for a single category, prove it works, then expand.
- Define the buying question. Start with a specific question: “Which ambient snack lines are selling below one unit per day?” Vague questions produce vague answers. A tight question tells you exactly which data to pull.
- Collect and clean the data. Pull EPOS sales for the relevant period, cross-reference with your current stock-on-hand, and check for any gaps caused by out-of-stocks that would distort the sell-through rate. Remove lines that were only stocked for a one-off promotion.
- Forecast and set reorder rules. Calculate average daily sales for each line, multiply by your supplier lead time in days, and add a safety stock buffer. That gives you a reorder point. For seasonal lines, apply a simple uplift based on last year’s trading pattern.
- Place orders and monitor availability. Use a digital ordering portal where possible. The audit trail from digital ordering removes invoice discrepancies and manual re-keying errors, giving you a clean demand history for future forecasting.
- Review performance and adjust. Woodford’s wholesale procurement guide recommends a 30-minute quarterly review correlating orders, sales, and wastage. That single habit materially improves reorder point accuracy over time.
KPIs to track at each review: sell-through rate, days of cover, forecast accuracy (actual vs ordered), waste percentage, and average basket value.
How can wholesalers and suppliers help you plan with data?
The most useful shift in wholesale buying is treating your wholesaler as a category partner rather than a price list. That only happens when data flows both ways.
The Wholesale Group’s DASHai solution integrates sales, promotions, and market trends into a shared platform, making up-to-the-minute information available to both members and suppliers. The result is that trading spikes can be anticipated rather than scrambled for.
“Supplier access to category reports lets producers and retailers build targeted plans previously only available to larger chains.” — Paul Hargreaves, Cotswold Fayre, via Retail Times
Practical collaboration options worth requesting from your wholesaler:
- A secure portal with role-based access so your buying team sees category performance without exposing commercially sensitive pricing to all staff.
- A shared promotional calendar so you can plan ranging and stock levels around confirmed promotions rather than guessing.
- Regular category review calls, even quarterly, where the wholesaler walks you through volume trends and highlights growing or declining lines.
- EDI integration if your order volumes justify the setup cost, which removes manual order entry entirely.
When a wholesaler dashboard shows a line declining 15% over eight weeks, you and your supplier can act jointly: a joint promotion, a range swap, or a targeted markdown. Without that shared view, you each act too late and separately.
What tools should you choose, and how do you evaluate them?
Prioritise data hygiene and integration over features you will not use in the first six months.
The capability checklist for an independent retailer:
- Digital ordering portal with a full audit trail (eliminates invoice disputes and builds demand history).
- EPOS integration so sales data flows automatically rather than requiring manual exports.
- Basic forecasting — even a simple days-of-cover calculation built into a spreadsheet beats gut feel.
- Supplier dashboards or at minimum a portal where your wholesaler can share category reports.
- Simple reporting exports in CSV or Excel so you are not locked into a single platform’s visualisation.
When evaluating vendors, ask three questions: Does it integrate with your existing accounting software (Xero, Sage, QuickBooks)? Can you export your own data at any time? What does onboarding actually involve in terms of staff hours?
Pro Tip: Pilot with a single category — ambient snacks or chilled beverages, for example. Run the five-step process for eight weeks, measure the change in sell-through rate and waste, and use that result to justify broader rollout internally.
Wholesale News reports that wholesalers using digital ordering platforms see around 75% of orders flowing through the app, with basket sizes rising approximately 20% and order processing time falling substantially. Those gains compound when staff time freed from manual entry is redirected into proactive account management rather than data re-keying.
What are the most common data mistakes buyers make?
Culture and question-driven use matter more than the volume of data you collect.
“Many teams gather data but fail to embed it into culture. The fix is leadership sponsorship and creating spaces where live data guides decisions.” — KPMG UK
The pitfalls that cost independents the most:
- Siloed data. EPOS in one system, orders in another, wastage in a notebook. No single view means no reliable analysis.
- Poor data quality. A product scanned under the wrong SKU for three months produces a misleading sell-through rate. Clean data beats more data.
- Confusing KPIs. Tracking 15 metrics and acting on none is worse than tracking three and acting on all of them.
- Over-reliance on a single source. EPOS sales alone miss the context of a local event, a competitor closure, or a supplier shortage.
- Skipping the review step. Collecting data without a scheduled review is the most common failure mode.
Red-flag audit: if you cannot answer “what is the sell-through rate on my top 10 lines this month?” within ten minutes, your data practice needs attention before your next buying cycle.
What does an implementation plan look like for a UK independent?
A pragmatic 8–12 week pilot can deliver measurable improvements without a large upfront investment.
- Weeks 1–2 (Audit). Export EPOS data for the last 13 weeks. Map your top 20 lines by revenue. Identify your three worst-performing lines by sell-through rate. Note which data is missing or unreliable.
- Weeks 3–4 (Set up). Request a category report from your wholesaler. Set up a simple reorder-point spreadsheet for your top 20 lines. Agree a shared promotional calendar with your main supplier.
- Weeks 5–8 (Pilot). Place orders using reorder-point rules rather than gut feel. Log actual sales vs forecast weekly. Track waste and markdowns separately.
- Weeks 9–12 (Review and scale). Run your first 30-minute quarterly review. Compare sell-through rate, days of cover, and waste percentage before and after. Use the results to extend the process to a second category.
Quick wins to track early ROI: reduction in out-of-stock incidents, change in waste percentage, and whether average order value through your portal has shifted.
Ballpark costs: EPOS export and spreadsheet-based forecasting costs nothing beyond staff time (roughly two to four hours to set up). A wholesaler portal is typically provided free by the wholesaler. A dedicated inventory or forecasting tool for a small independent ranges from around £30 to £150 per month depending on features. The inventory management guidance on the Woodford blog covers practical approaches at each budget level.
Pro Tip: Keep the initial scope to one category and one wholesaler relationship. Trying to fix all buying decisions at once produces paralysis. One category, eight weeks, three KPIs.
A UK case example: wholesaler data improving category performance
When a wholesaler shares category-level performance data with retail partners, the results show up quickly in the numbers. The pattern documented across UK wholesale operations using digital ordering platforms is consistent: order processing time falls, basket sizes rise, and stockout frequency drops.
| Metric | Before shared data | After shared data |
|---|---|---|
| Orders placed via digital portal | Low manual-entry mix | ~75% via portal |
| Average basket size | Baseline | ~20% increase |
| Order processing time | High (manual re-keying) | Substantially reduced |
| Repeat stockout incidents | Frequent | Materially reduced |
Source: Wholesale News, reporting on wholesalers using digital ordering platforms.
The practical steps that produced these results: the wholesaler opened portal access to retail partners, shared weekly category volume reports, and reallocated staff time from order entry to proactive account calls. Retail buyers used the category data to adjust ranging, cut slow lines, and build joint promotions around confirmed volume trends.
“When wholesalers, retailers and suppliers share access to integrated, real-time data, forecasting and promotional planning become collaborative rather than speculative.” — The Wholesale Group
The buying team owned the reorder-point rules; the wholesaler account manager owned the category insight calls. That division of responsibility is what made the change stick.
How should you handle privacy and data security when sharing sales data?
Sharing sales and customer data with wholesalers and suppliers requires a clear legal basis under the UK GDPR, administered by the Information Commissioner’s Office. For most wholesale buying contexts, the data being shared is transactional and commercial rather than personal, which reduces the compliance burden. But the rules still apply when customer loyalty data, email addresses, or purchasing profiles are involved.
Practical steps: use role-based access controls so only the people who need a dataset can see it. Agree data-sharing terms in writing with your wholesaler before connecting any integrated portal. Anonymise or aggregate customer-level data before sharing it externally. Review your privacy notice if you are using customer purchase data to inform buying decisions, since that constitutes processing for a new purpose.
For compliance in UK food wholesale, transparent data practices also strengthen commercial relationships. A wholesaler that knows you handle data carefully is more likely to share sensitive category intelligence with you.
This article is general information, not legal or compliance advice. Confirm your specific obligations with the ICO or a qualified data protection professional.
How do you train staff to use data in buying decisions?
The biggest barrier to data-driven buying in independent retail is not technology. It is confidence. Most buying staff can read a spreadsheet; fewer know which question to ask of it.
Start with a single metric per role. A buying manager tracks sell-through rate. A shop floor supervisor tracks days of cover for the top ten chilled lines. A brand owner tracks category share within their wholesale partner’s range. One metric, owned by one person, reviewed on a fixed schedule.
Structured learning does not need to be expensive. The ONS guide to retail sales data is free and explains how to read index figures. Your EPOS vendor’s help centre usually covers basic reporting. For broader data literacy, short courses on platforms such as LinkedIn Learning or Google’s free data analytics fundamentals cover the concepts a buying team needs without requiring a formal qualification.
The cultural shift matters as much as the skills. KPMG UK’s research describes “data safe spaces” where teams are encouraged to test a hypothesis with live data without fear of being wrong. For a small independent, that might simply mean a monthly ten-minute slot in a team meeting where one data finding is discussed and one action is agreed.
How do you combine customer feedback with sales data to buy more accurately?
Quantitative data tells you what sold. It does not tell you why a customer chose it, or why they stopped. Combining the two gives you a buying signal that neither source provides alone.
Practical integration methods:
- In-store feedback. A simple paper or tablet-based prompt at the till (“What would you like to see more of?”) generates qualitative signals that can be mapped against EPOS gaps. If customers repeatedly name a category you do not stock, that is a ranging opportunity your sales data cannot surface.
- Social listening. Monitor your own social media comments and local community groups for product requests and complaints. Cross-reference with your sell-through data to confirm whether demand is real or anecdotal.
- Supplier sell-out data. Some suppliers share consumer panel data or regional trend reports. Cotswold Fayre’s CoFI service, for example, gives suppliers sales performance by customer type and time period. That kind of segmented view helps you understand not just volume but who is buying and when.
- Returns and complaints log. A product that sells well but generates frequent complaints or returns is a margin risk. Tracking this alongside sales data prevents you from reordering a problem line purely because the sell-through rate looks healthy.
The goal is a buying decision that reflects both the numbers and the context behind them. Use food trend analysis to validate whether a customer request reflects a broader market shift or a local preference worth acting on independently.
Key takeaways
Data-driven retail buying works when you ask specific questions of clean, integrated data, review it on a fixed schedule, and share it with your wholesaler as a collaborative planning tool.
| Point | Details |
|---|---|
| Start with EPOS exports | Pull your top 20 lines by revenue and check sell-through rate before your next order. |
| Request wholesaler category reports | Most wholesalers provide these on request; they reveal volume trends you cannot see from your own till data alone. |
| Use a 30-minute quarterly review | Correlating orders, sales, and wastage on a fixed schedule materially improves reorder accuracy over time. |
| Prioritise data hygiene over data volume | Clean, integrated data from two sources beats fragmented data from ten. |
| Woodford as your data-enabled partner | Woodford’s digital ordering portal and category insight support give UK independents the shared data infrastructure to plan collaboratively. |
Woodford gives UK independents a data-enabled buying advantage
Independent retailers who want the benefits of shared category data without building the infrastructure themselves have a direct route through Woodford. As the UK’s leading strategic food wholesaler, Woodford combines exclusive brand distribution with a digital ordering portal that creates a clean, auditable demand history from day one. Category insight, trend-led curation, and trading support come as part of the relationship, not as an add-on.
For brand owners, Woodford’s retail network reach means your sell-out data reaches the right independent buyers, with the context to act on it. For retailers, it means your wholesaler is already doing the category analysis work and sharing it with you.
The next step is straightforward: explore Woodford’s wholesale offer and ask about portal access and category reporting for your account. If you are planning a range review, the snack category guidance from Spaceman is a useful complement to your own EPOS data.
Useful sources and further reading
- GOV.UK Business Data Use and Productivity Study (DUPS) — the primary UK government evidence base linking data activity to productivity gains in wholesale and retail.
- KPMG UK: Curiosity, Culture, Quality — practical framework for embedding data into buying culture, with specific warnings about common failure modes.
- The Wholesale Group via Wholesale Manager — explains the DASHai shared-data model and what collaborative wholesale planning looks like in practice.
- Cotswold Fayre and TWC Group via Retail Times — case study on supplier-retailer data transparency and Paul Hargreaves’s perspective on category reporting for independents.
- Woodford wholesale procurement guide — practical buying process guidance including the quarterly review methodology.
- ONS Retail Sales Index — free monthly data on UK retail sales volumes and values; useful as a macro context layer for your own store data.
- Ask your wholesaler directly what dashboard exports and category reports are available on your account. Most can provide more than they routinely send.


